
How to Check GPU Usage: A Step-by-Step Guide
To check your GPU usage, you can easily use built-in tools like Task Manager on Windows or Activity Monitor on Mac. For more detailed performance metrics, consider dedicated software like MSI Afterburner or your GPU manufacturer’s own utilities. This helps you see how hard your graphics card is working during games or other demanding tasks.
Understanding your GPU usage is key for troubleshooting performance issues. When your GPU is maxed out, it’s often the bottleneck in your system. This means your CPU might be waiting for the GPU, or vice-versa. Monitoring it helps you identify if your hardware is up to the task or if it’s time for an upgrade. Many gamers and creative professionals rely on this data.
- Use Task Manager (Windows) or Activity Monitor (Mac) for quick checks.
- MSI Afterburner offers advanced monitoring for gamers.
- Manufacturer software (NVIDIA GeForce Experience, AMD Radeon Software) is also helpful.
- High GPU usage can indicate a performance bottleneck.
- Low GPU usage might point to a CPU bottleneck or other issues.
Let’s walk through exactly how to check your GPU usage using these methods, step by step.
How to See Your GPU’s Workload
Knowing how hard your graphics card, or GPU, is working is super helpful. It tells you if your rig can handle certain tasks. Think of it like checking a car’s RPMs. You want to see if the engine is running smoothly or if it’s about to redline. We’ll show you how to peek under the hood.
Using Built-In Tools for a Quick Look
Most operating systems have tools that let you monitor your hardware. These are usually the easiest way to get a general idea of your GPU usage.
Windows: Task Manager is Your Friend
Windows has a built-in tool called Task Manager. It’s great for a quick check. You can see your GPU usage percentages right there. This is often the first place people look when something feels slow.
Opening Task Manager
There are a few easy ways to open Task Manager. You can press Ctrl + Shift + Esc on your keyboard. Another quick method is to right-click on the taskbar and select “Task Manager.” Sometimes, pressing Ctrl + Alt + Delete and choosing Task Manager works too.
Finding GPU Information
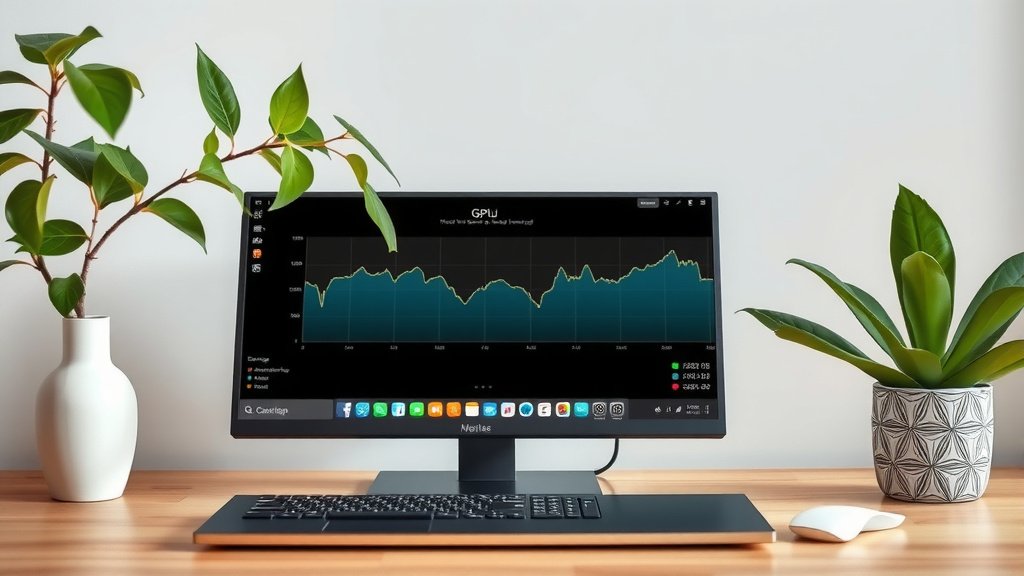
Once Task Manager is open, you’ll see a few tabs. Click on the “Performance” tab. You should see a list of hardware components on the left side. Look for “GPU.” Click on it. You’ll see graphs showing your GPU’s utilization over time. This display shows you the percentage of its power being used at that moment.
Understanding the Graphs
The graph you see shows GPU utilization. A high percentage means your GPU is working hard. A low percentage suggests it’s not being taxed much. If you see spikes, it’s usually when you’re running a demanding application, like a game or video editor. Stable high usage might mean your GPU is the reason for performance limitations.
Mac: Activity Monitor for Mac Users
Mac users have a similar tool called Activity Monitor. It also provides a good overview of your system’s performance, including GPU activity.
Launching Activity Monitor
You can find Activity Monitor in your Applications folder, under the Utilities subfolder. A faster way is to use Spotlight search. Just press Command + Spacebar, type “Activity Monitor,” and hit Enter.
Viewing GPU Metrics
Once Activity Monitor is open, look for the “GPU History” window. You might need to go to the Window menu and select “GPU History” if it doesn’t appear automatically. This window shows you the activity of your GPU. It includes metrics like GPU usage and VRAM usage. You’ll see a graph that lets you monitor usage over time.
What the Graphs Mean
Similar to Windows, a high percentage on the GPU usage graph means your graphics card is busy. Low numbers indicate less demand. Many Mac users find this helpful for spotting which applications are using the most GPU resources. This can help you close unnecessary programs to free up power.
Deeper Dives with Third-Party Software
For a more detailed look, especially for gamers and power users, third-party software offers more advanced features. These tools can often provide real-time overlays and detailed statistics.
MSI Afterburner: The Gamer’s Choice
MSI Afterburner is a very popular free tool. It’s known for its extensive monitoring and overclocking capabilities. Even if you don’t overclock, its monitoring features are top-notch.
Installation and Setup
You can download MSI Afterburner from the official MSI website. During installation, you’ll often be prompted to install RivaTuner Statistics Server (RTSS) as well. RTSS is what enables the on-screen display (OSD) that shows your GPU usage directly in games. You’ll want to enable this feature in Afterburner’s settings.
Customizing Your On-Screen Display (OSD)
In MSI Afterburner’s settings, navigate to the “Monitoring” tab. Here, you can select which hardware information you want to see on your screen. Look for entries like “GPU usage,” “GPU temperature,” and “Framerate.” For each one you want to display, check the box next to it and then tick the “Show in On-Screen Display” option. This lets you see everything live while you’re playing a game.
Interpreting MSI Afterburner Data
This software gives you a very granular view. You can see the exact percentage of your GPU’s load. You can also monitor temperatures, clock speeds, and fan speeds. If your GPU usage is consistently at 95-100% during gameplay, it’s likely the bottleneck. This can lead to lower frame rates and stuttering.
Manufacturer Utilities: NVIDIA and AMD
Both NVIDIA and AMD provide their own software that can monitor GPU usage.
NVIDIA GeForce Experience
If you have an NVIDIA graphics card, you likely have GeForce Experience installed. It offers game optimization features and drivers. It also has a performance overlay you can enable.
Enabling the Performance Overlay
Open GeForce Experience. Go to Settings. Under the “General” tab, you’ll find “In-Game Overlay.” Click the gear icon next to it. Then, select “Performance” from the overlay options. You can customize what information appears on your screen, including GPU utilization.
AMD Radeon Software
For AMD users, the Radeon Software provides similar functionality. It’s designed to manage your graphics card settings and monitor performance.
Accessing Radeon Performance Metrics
Open the AMD Radeon Software. You can usually access the performance metrics by pressing Alt + R to bring up the overlay. Look for the “Performance” tab. Here, you can enable “Overlay” and select which metrics to display. GPU utilization is a key metric shown here. It helps you see how hard your AMD card is working.
When Usage Tells a Story
Monitoring your GPU usage isn’t just about numbers. It helps you understand your system’s behavior. High GPU usage (approaching 100%) often means your graphics card is doing all it can. If your frame rates are still low, it could be that your GPU is simply not powerful enough for the task. This is a common bottleneck scenario. Many experts suggest looking at GPU usage as a primary indicator of graphics-related performance (NVIDIA).
Conversely, low GPU usage when you expect high usage (like in a demanding game) might point to a different issue. It could mean your CPU is the bottleneck. Your CPU might be struggling to send enough data to the GPU, leaving it idle. Or, there might be software issues or driver problems causing the low utilization. Some research suggests driver updates can often resolve unexpected low GPU usage (AMD).
Quick Checklist for Monitoring Your GPU
- Open Task Manager (Windows) or Activity Monitor (Mac).
- Find the GPU section in the performance tab.
- Note the current GPU utilization percentage.
- For gamers, consider MSI Afterburner or manufacturer software.
- Enable the on-screen display (OSD) for real-time stats.
- Observe usage during demanding tasks to identify bottlenecks.
Conclusion
You’ve learned how to check your GPU usage using simple tools like Task Manager and Activity Monitor, and how to get more detailed stats with software like MSI Afterburner. Understanding your GPU’s workload is key to diagnosing performance issues. Whether you’re a gamer aiming for smoother frame rates or a professional needing every ounce of power, knowing your GPU’s status helps you identify bottlenecks. If your GPU is maxing out, it might be time to consider an upgrade. If it’s underutilized, you might have a CPU bottleneck or a software issue. Take a moment to check your GPU usage the next time you experience performance dips.
Frequently Asked Questions
What does 100% GPU usage mean?
When your GPU usage hits 100%, it means your graphics card is working as hard as it possibly can. This is often normal during demanding tasks like gaming or video rendering. However, if you’re experiencing performance issues like low frame rates or stuttering, high GPU usage can indicate it’s the bottleneck in your system.
Why is my GPU usage low when playing a game?
Low GPU usage during a game can mean your CPU is the bottleneck. Your CPU might not be sending enough data to the GPU, leaving it waiting. It could also be due to poorly optimized game settings, outdated drivers, or other background applications consuming resources. Check your CPU usage alongside your GPU usage to get a clearer picture.
Can I check GPU usage without installing software?
Yes, you can check your GPU usage using your operating system’s built-in tools. Windows users can utilize Task Manager, and Mac users can use Activity Monitor. These tools provide a quick overview of your GPU’s current utilization percentage without needing to download any extra programs.
Is it bad if my GPU is always at high usage?
It’s not inherently bad for your GPU to run at high usage, especially during demanding tasks. It shows your hardware is being utilized effectively. However, if sustained high usage leads to overheating or performance issues, it might suggest your GPU is struggling to keep up with the demands, potentially needing a cooler setup or an upgrade.
How often should I check my GPU usage?
You don’t need to check your GPU usage constantly. It’s most helpful to monitor it when you encounter performance problems, such as slow loading times, stuttering in games, or issues with graphics-intensive applications. Regularly checking it during these times can help you pinpoint whether your GPU is the cause.


![10 Best Gpu For External Gpu [2026]](https://spsolutionscare.com/wp-content/uploads/2026/09/10-best-gpu-for-external-gpu-2026-featured-768x432.jpg)