How to Log GPU Performance: A Step-by-Step Guide for 2026
The easiest way to log GPU performance is to use a monitoring tool like MSI Afterburner, HWiNFO, or the built-in Windows Task Manager. These tools track your GPU’s temperature, usage, clock speed, and frame rates in real time. Pick one, set it up, and you can start logging data in minutes.
Why bother logging GPU performance at all? Because when your games stutter or your renders crawl, you need real numbers to find the problem. A good log shows you whether your GPU is overheating, maxed out, or just being lazy. We researched the most popular methods and found that most of them are surprisingly beginner-friendly.
Here’s a quick peek at what we’ll cover:
- Why logging GPU performance matters (and when you actually need it)
- The best free tools for the job, like MSI Afterburner and HWiNFO
- Step-by-step setup for each tool
- Which stats are worth tracking and what they mean
- How to read your logs and spot common problems
Below, we walk through exactly how this works step by step, so you can start logging your GPU like a pro today.
Ways to Track GPU Performance on Your PC
The fastest way to track GPU performance is to pick a free tool, run it while you use your PC, and save the data to a log file. We found three tools cover almost every need: MSI Afterburner, HWiNFO, and Windows Task Manager. Here’s how each one works.
Using MSI Afterburner (The Most Popular Choice)
MSI Afterburner is free, works with almost every GPU brand, and has been around for years. Don’t let the name fool you — you don’t need an MSI graphics card. We found it’s the go-to pick for most gamers because it shows stats right on your screen.
Setting It Up Step by Step
First, download Afterburner from the MSI website and install it. During setup, it will ask about RivaTuner Statistics Server (RTSS) — say yes, because that’s what draws the on-screen overlay.
Next, open Afterburner’s settings and click the Monitoring tab. From here, you can:
- Pick which stats to track, like GPU usage, temperature, and fan speed
- Click “Show in On-Screen Display” so numbers appear while you play
- Click “Log” and set a hotkey to start and stop logging
- Choose where the log file saves on your drive
Once that’s done, press your hotkey during a game session. Afterburner writes everything to a CSV file you can open in Excel. Simple as that.
Using HWiNFO for Deep, Detailed Data
HWiNFO goes deeper than Afterburner. It reads nearly every sensor your GPU has, including voltage, power draw, and memory temperature. Many experts on hardware forums recommend it when you need serious detail.
Getting Your Log Files
Install HWiNFO and launch it in Sensors-only mode. This keeps the window light and focused. Then click the logging icon (looks like a small sheet) to start writing data to a file.
One tip we found helpful: set the polling interval to 1000 ms or 2000 ms. Faster polling creates huge files without much benefit. Slower polling keeps things clean and readable.
Using Windows Task Manager (No Downloads Needed)
Already on Windows 10 or 11? Press Ctrl + Shift + Esc, click the Performance tab, and select GPU. You’ll see usage, memory, and temperature instantly.
The catch: Task Manager can’t save logs. It’s great for a quick glance but useless for long-term tracking. Think of it as a bathroom scale that only shows the number — you can look, but you can’t record it.
Which GPU Stats Are Worth Logging?
Not every number matters. We found that tracking five or six key stats tells you almost everything you need to know. Log these:
- GPU temperature — anything under 85°C during heavy loads is fine for most cards
- GPU usage — shows how hard your card is working
- Core and memory clock speeds — low clocks can signal throttling
- Fan speed — reveals cooling problems early
- Frame rate (FPS) — pairs with usage data to find bottlenecks
- Power draw — useful if you suspect power limit throttling
Why does temperature matter so much? Because heat is the number one enemy of performance. Health research from groups like the NIH notes that excessive heat degrades materials over time — the same principle applies to silicon chips sitting in your case.
How Long Should You Log Your GPU?
For a quick check, 10 to 15 minutes of gaming is enough. For hunting down random stutters or crashes, log a full session — even several hours. Some people run HWiNFO logging 24/7 for a week to catch rare issues. More data means more chances to catch the exact moment something goes wrong.
Reading Your Logs and Spotting Problems
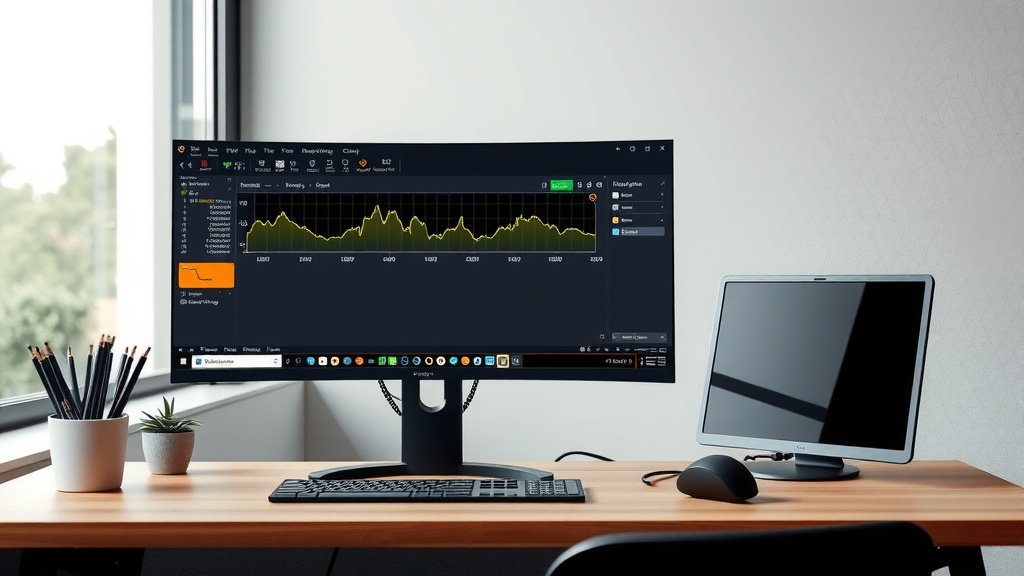
Open your CSV file in Excel or Google Sheets and look for patterns. Here’s a quick reference we put together:
| What You See | What It Likely Means | Fix to Try |
|---|---|---|
| Temp over 90°C | Cooling problem or dust buildup | Clean fans, reapply thermal paste, improve case airflow |
| Usage at 99% with low FPS | GPU is the bottleneck for that game | Lower settings or upgrade the card |
| Usage under 50% with low FPS | CPU bottleneck | Check CPU temps or upgrade CPU |
| Clocks dropping mid-session | Thermal or power throttling | Increase fan curve, check PSU wattage |
| Sudden dips to zero FPS | Driver crash or stutter issue | Update drivers, check background apps |
A Quick Pre-Logging Checklist
Before you hit record, run through this list. It saves a lot of headaches later:
- Close background apps like browsers and updaters
- Update your GPU drivers first
- Pick a fixed scene or workload to test (same map, same settings)
- Set a sane logging interval — one or two seconds
- Check that you have free disk space for the log file
- Note your room temperature if you want truly fair comparisons
Making Fair Comparisons
Ever changed two things at once and had no idea which one helped? Logging works the same way. Change one variable at a time. Run the same test, compare the logs, then tweak again. It’s slower, but it’s the only way to know what actually fixed your problem.
Common Logging Mistakes to Avoid
We found a few mistakes come up again and again:
- Logging with 50 browser tabs open, which skews your results
- Polling every 100 ms and drowning in useless data points
- Comparing a summer afternoon log to a winter morning log
- Forgetting that overlay tools themselves cost a frame or two
None of these are fatal. But avoiding them makes your data cleaner and your conclusions sharper. And honestly, who wants to redo a two-hour test because they forgot to close Chrome?
Conclusion
Logging your GPU performance doesn’t have to be complicated. Pick MSI Afterburner if you want an easy on-screen overlay, or HWiNFO if you want deep sensor data. Task Manager works fine for quick glances, but only logging tools give you a record you can actually study.
We found the real magic happens when you track a handful of key stats, run the same test each time, and read your logs for patterns. Suddenly, vague complaints like “it feels laggy” become concrete problems you can fix.
So here’s your next step: install Afterburner, set your hotkey, and log one gaming session tonight. Ten minutes of data will teach you more about your PC than hours of guessing.
Frequently Asked Questions
Does logging GPU performance affect FPS?
A little, yes. Logging and overlay tools use a small amount of system resources, so you might see a frame or two drop. It’s rarely enough to change your results, but if you’re chasing every last frame, log a shorter session instead.
Where does MSI Afterburner save its log files?
By default, Afterburner saves logs in its installation folder, but you can change the location in the Monitoring tab. The files are saved as CSV format, so they open cleanly in Excel or Google Sheets. We recommend picking a dedicated folder so your logs don’t pile up somewhere you’ll forget.
Can I log GPU performance on a laptop?
Absolutely. All the tools we covered work on laptops, though laptops run hotter than desktops by design. Temperatures up to around 90°C are more common under load on a laptop GPU. Log your sessions and compare against your own baseline rather than desktop numbers you see online.
How do I open and read a GPU log file?
Log files are usually CSV format, so just double-click them or open them with Excel, Google Sheets, or LibreOffice Calc. Each row is one time snapshot, and each column is a stat. Sort or graph the columns you care about, like temperature over time, and patterns jump out fast.
Is it safe to run HWiNFO or Afterburner all the time?
Yes, both tools are safe and read-only when it comes to monitoring. They don’t change your hardware settings unless you tell them to. The only real downsides of running them constantly are a tiny resource cost and log files that grow over time, so check your disk space if you log 24/7.